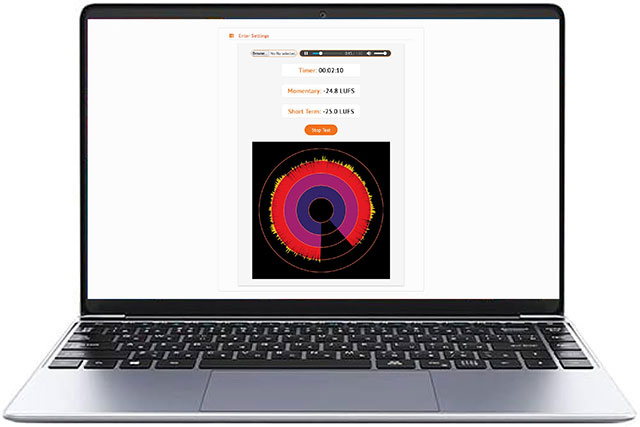
 Maztr's free online
Audio Loudness Visualizer is a quick and easy tool you can use right in your browser, without downloading any software, to visualize the
fluctuating loudness levels in your audio files. No account or login is required to use it.
Our Loudness Visualizer lets you "see" how loud your audio files are, in real time. Want a more detailed analysis of the loudness of your audio files, including Integrated LUFS? Click here to use our free Audio Loudness Meter.
If you want to edit the volume of your audio files, click here to use our Audio Volume Editor. We have many more free tools for your audio files. Click here to check them out.
You may also like to try our other visualizers:
QUICK START: Click or choose your own file, then click "Start Test" below.

The Visualizer shows loudness measured in LUFS. Loudness is calculated for Momentary and Short Term LUFS and the output is also graphed on a circular scale. This output complies with the ITU-R BS.1770-2 LKFS loudness standards.
Quieter sounds show output closer to the center of the graph, while louder sounds push out towards the outer circumferance of the graph.
LUFS, which means "Loudness Units Full Scale", is similar to decibels (dB) but measures loudness in a way that compensates for human hearing perception. "Momentary LUFS" indicates loudness at a specific moment whereas "Short Term LUFS" is a three-second moving average of these values.
Understanding LUFS is crucial in audio production for maintaining consistent loudness across various music platforms. It helps to ensure the best sound quality in all playback environments, particularly when services like Spotify, YouTube and Apple Music adjust their tracks to specific LUFS levels for uniformity.
Volume is a scientific measure of sound intensity, while loudness is a subjective perception influenced by factors like sound pressure level, frequency content and duration.
Check out our Audio Loudness Meter which includes a more detailed discussion on the subject of audio loudness.